Generating Deviation Maps
For analysis and visualization purposes, you can compute and generate color-coded meshes showing the deviation (distance) between the normals of two sets of meshes. For example, to compare a mesh generated in AutoCAD from a designed part with a mesh generated from a scan of the manufactured part.
Distance maps can be examined in 3D and 2D views with referential values color-mapped according to the applied look-up table (LUT) and the type of distance map requested — signed or unsigned.
Signed distance map in 3D

Deviation (distance) map measurements are added to the selected mesh and appear in Scalar information box, as shown below.
Mesh scalar information

The measurements available in the Mesh scalar information box on the Data Properties and Settings panel include the minimum and maximum distance values of the local deviation.
Min… Is the minimum distance value for the deviation between the selected meshes.
Max… Is the maximum distance value for the deviation between the selected meshes.
- Right-click the required mesh in the Data Properties and Settings.
- Do one of the following:
- Choose Deviation Map in the pop-up menu to compute the absolute deviation values.
- Choose Signed Deviation Map in the pop-up menu to generate a signed deviation map.
Signed deviation maps will calculate deviations as positive or negative, depending on their direction from the surface of the mesh.
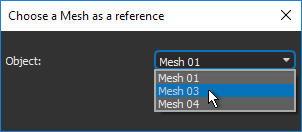
- Choose the mesh that will be used as the reference for the deviation map in the Choose a Mesh as a Reference dialog.
-
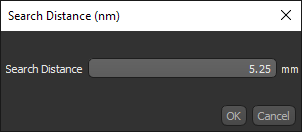
Choose the maximum search distance for computing the distance map in the Search Distance dialog, shown below.
- Click OK to generate the deviation map.
The distance map is calculated automatically and the deviation is shown on screen in the legend with the current LUT applied. In addition, the Scalar information box is updated with the minimum and maximum deviation for the selected map.
Note You can also examine the deviation map with the Measurement Inspector (see Evaluating Scalar Meshes with the Measurement Inspector).
